Managed WordPress - Enabling and customising debug mode
 Updated 1 month ago
by
Tristan Payne
Updated 1 month ago
by
Tristan Payne
WordPress is a PHP based Content Management System (CMS), so at some point you may need to troubleshoot a PHP error. One of the most common symptoms is the infamous "white screen", where the site simply displays a blank white page.
There are a number of places you can look for information to help pinpoint what's causing the problem. This includes the built in error log tab.
WordPress also has its own PHP debugging functionality, which can be enabled through your wp-config.php file. This file is normally located in the web root directory of your site and contains a number of configuration options that control how WordPress operates, including its debugging behaviour.
How to enable debug mode
- Login to your Managed WordPress Dashboard
- Select the site you'd like to log in to
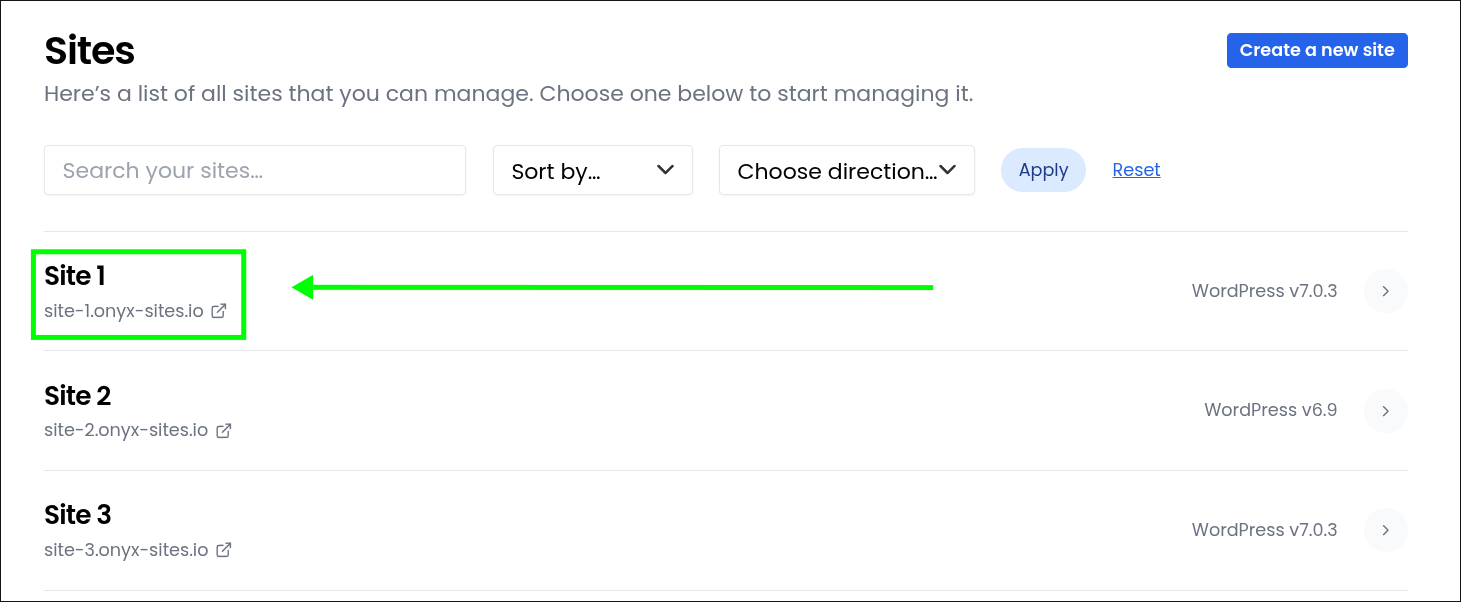
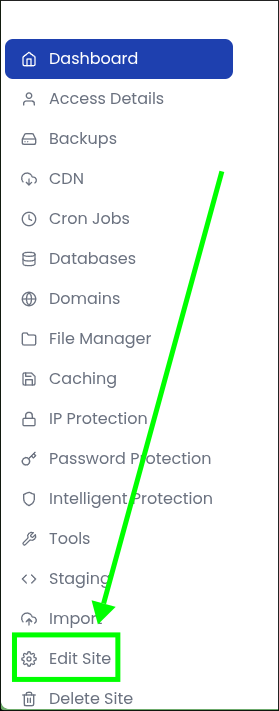
- Click the "Edit Site" tab
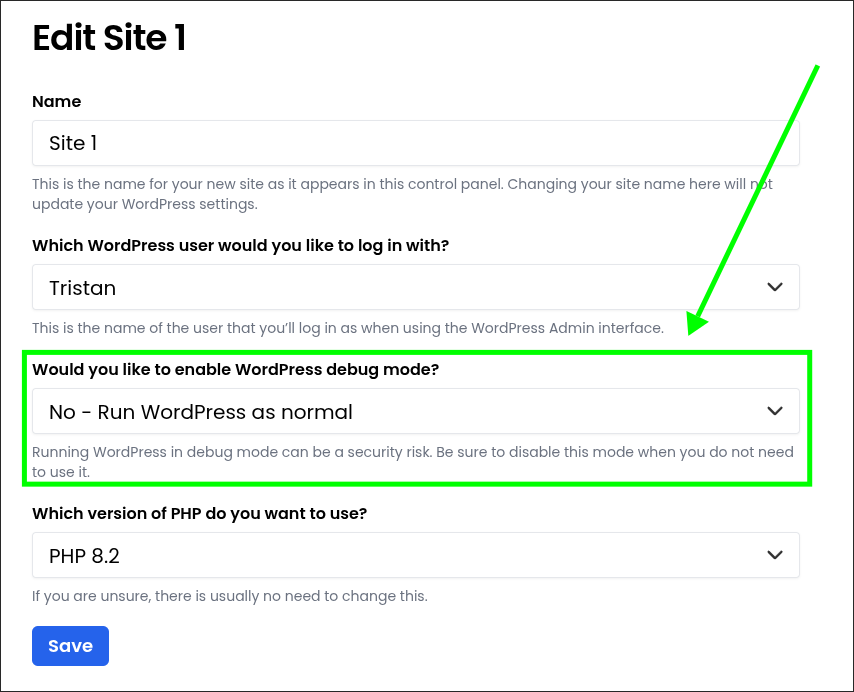
- Click the "Would you like to enable WordPress debug mode?" dropdown
- Select "Yes - Enable WordPress debug mode"
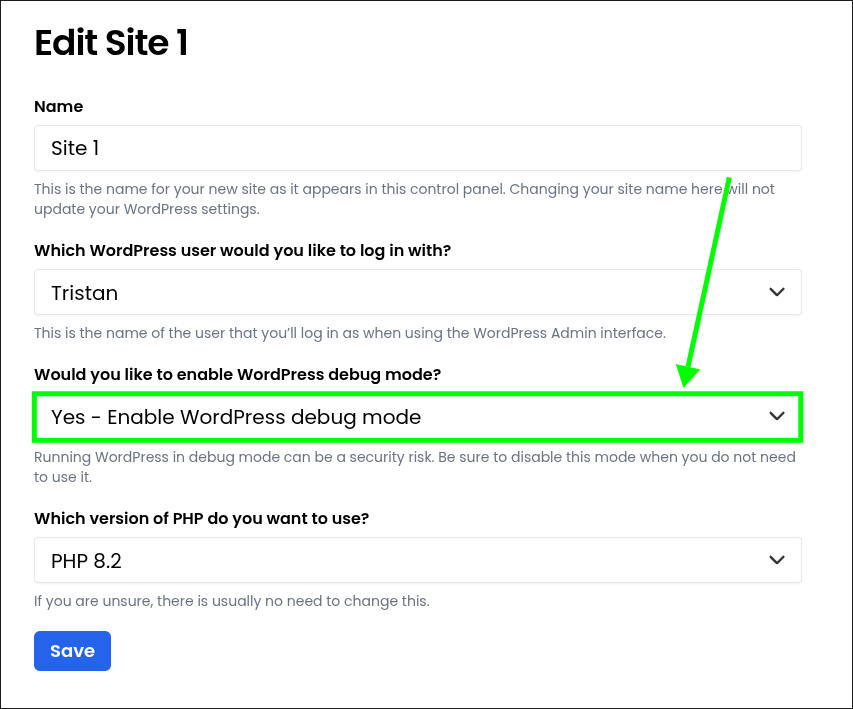
- Save
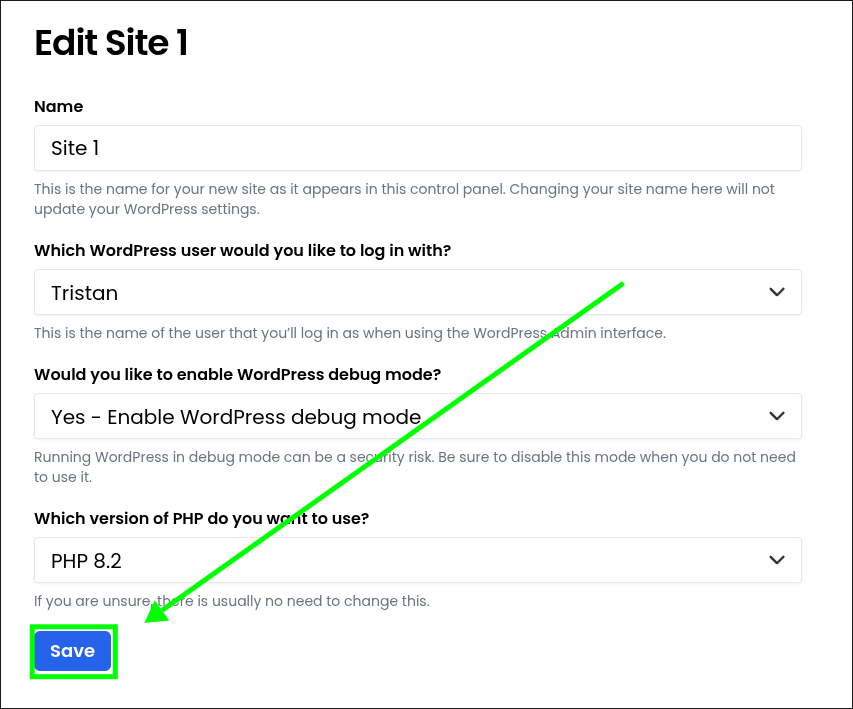
- Done!
Customising debug mode
Once debug mode has been enabled, there are other options you can set to do things like turn debugging on - but write errors to a file instead of to the screen.
Editing wp-config
- Click The "File Manager" tab
- Click the "html" directory
- Click "wp-config.php"
WordPress debugging is controlled through a handful of constants that you add to wp-config.php, normally above the /* That's all, stop editing! */ line. Here are the main configurations and what each one does.
1. Basic debug mode
Enables WordPress debugging, including PHP errors, warnings and notices.
define( 'WP_DEBUG', true );
2. Debug logging
Writes errors to /wp-content/debug.log rather than displaying them on-screen, although errors may still be displayed depending on the other configuration.
define( 'WP_DEBUG', true );
define( 'WP_DEBUG_LOG', true );
3. Debug log to a custom path
On WordPress 5.1 and newer, you can specify a custom location for the debug log instead of using /wp-content/debug.log.
define( 'WP_DEBUG', true );
define( 'WP_DEBUG_LOG', '/absolute/path/to/custom-debug.log' );
4. Hide errors from visitors but continue logging them
This is generally the safest option when debugging a staging or production site. Errors are recorded in the log without being displayed to visitors.
define( 'WP_DEBUG', true );
define( 'WP_DEBUG_LOG', true );
define( 'WP_DEBUG_DISPLAY', false );
5. Display errors without logging them
This can be useful for quick debugging in a local development environment, but isn't generally recommended on a live site.
define( 'WP_DEBUG', true );
define( 'WP_DEBUG_DISPLAY', true );
define( 'WP_DEBUG_LOG', false );
7. Database query debugging
SAVEQUERIES stores database queries, their execution time and what called them in the $wpdb->queries array. This can be useful when investigating database or performance issues, but it adds overhead and should generally only be enabled during development or targeted troubleshooting.
define( 'WP_DEBUG', true );
define( 'SAVEQUERIES', true );
Our recommended configuration for live environments
The configuration below will write your errors to wp-content/debug.log, without displaying them on the front-end of your site:
define( 'WP_DEBUG', true );
define( 'WP_DEBUG_LOG', true );
define( 'WP_DEBUG_DISPLAY', false );
A few things worth keeping in mind
WP_DEBUG_LOGandWP_DEBUG_DISPLAYonly have an effect whenWP_DEBUGis enabled.- Avoid enabling
WP_DEBUG_DISPLAYon a live production site. PHP errors and warnings can expose file paths, configuration details and other information that shouldn't be visible to visitors. SAVEQUERIEScan have a noticeable performance impact, so it's best enabled only for as long as you actually need it.- Debug logs can grow considerably over time, particularly on a site generating a large number of warnings or notices. We recommend disabling debug mode and clearing your log file after troubleshooting. At a minimum,
WP_DEBUG_DISPLAYshould remain disabled on production sites.
Additional options can be found in this WordPress.org article - Debugging in WordPress.
